
Ole Andreas Halvorsen's Viking Global Investors cut 50% of its stock positions in 2026 Q3, according to the 13F-HR filed with the SEC on November 16, 2026, 45 of the 90 stock positions it started the quarter with, most of them sold out. Of those, 35 were sold out and 10 trimmed. The total portfolio value is about $32.7B, down 7% from the prior quarter.
What did the 2026 Q3 filing report?
As of September 30, 2026, from the 13F-HR filed November 16, 2026.
| Value | |
|---|---|
| Stock positions | 90 to 79 |
| Positions cut | 45 |
| Median cut | 100% |
| Sold out | 35 |
| Trimmed | 10 |
| Reported value | $35.1B to $32.7B |
What was cut?
The largest cuts by percent change to portfolio were SCHW (sold out from 2.8%), V (trimmed from 6.25% to 4.73%) and TMO (trimmed from 2.77% to 1.9%). Against that, Ole Andreas Halvorsen opened 24 and added to 25.
What does the Ole Andreas Halvorsen portfolio look like now?
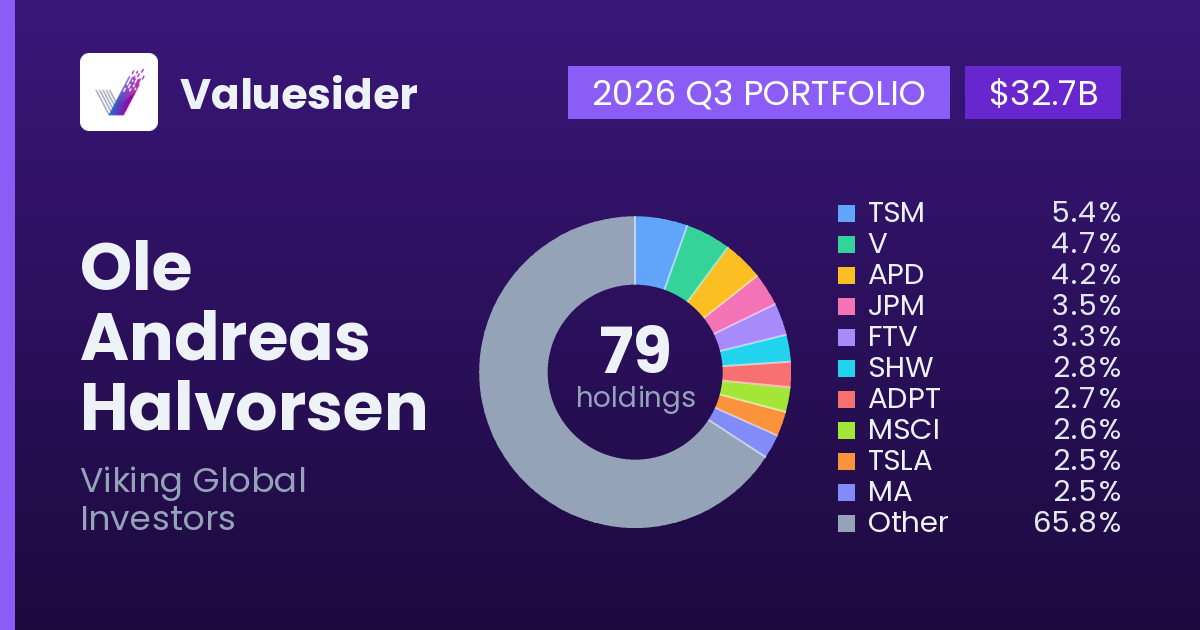
Ole Andreas Halvorsen's Viking Global Investors reported 79 stock positions in its 2026 Q3 portfolio, down from 90 a quarter earlier. The total portfolio value is about $32.7B, down 7% from the prior quarter. The largest stock position is TSM at 5.45%. Next come V at 4.73% and APD at 4.18%. The three largest stocks together are 14.36% of the book.
FAQ
How many positions did Ole Andreas Halvorsen cut in 2026 Q3?
Ole Andreas Halvorsen cut 45 of the 90 stock positions it went into 2026 Q3 with: 35 sold out and 10 trimmed by 30% or more of the shares.
Did Ole Andreas Halvorsen sell everything?
No. The 2026 Q3 filing still lists 79 stock positions, and the reported portfolio value is about $32.7B.
How did the reported portfolio value change?
The reported portfolio value went from about $35.1B to about $32.7B, down 7% from the prior quarter. A 13F marks the positions it lists at quarter-end prices, so the value mixes sales with price moves, while the count of positions cut does not.